
Introducing Tiler
James MilnerOne key thing we are always interested in exploring at the Geovation Hub is the future of mapping and geospatial technologies. For a long time mapping has relied on stitching together images at different zoom levels to produce the traditional web map.
In recent times, there has been a push towards using the underlying vector data (i.e. Points, Lines, Polygons) that produce those tiles rather than an image (raster) representation of that data. This has been led predominantly by Mapbox underpinned by their open Vector Tile specification. The specification has gained traction with other mapping providers such as Esri and Mapzen.
Vector Tiles allow for a host of benefits including re-styling on the client, generally less pixelation, smoother transitions between zoom layers, and hardware acceleration from the GPU using HTML5 Canvas or WebGL. In addition things like labels can also be dynamic and retain orientation with rotation of the map.
One thing we found when exploring how we might take Ordnance Survey Open Data such as Open Map Local and turn them into vector tiles is a lot of the pipelines and processes for creating the raw underlying tiles were somewhat fragmented, convoluted or restricting.
Thankfully we found lots of tools that did individual pieces of what we needed; we just needed to package them together. This was when the idea of Tiler was born. Tiler aims to be a (relatively) simple to use pipeline for taking traditional vector data from sources like Shapefiles, GeoJSON, GML or PostGIS and turning them into raw Vector Tiles that you can use with clients such as Mapbox GL or OpenLayers (as examples).
Tiler bundles together some powerful tools, stitching them together with Python and abstracting them away into a configuration-oriented approach to generating tiles. One defines a JSON config file for a series of data and then can produce tiles using that config with Tiler.
A Consistent Environment
Tiler uses Docker; a container platform. Containers allow us to bundle up complex applications as ‘images’ which we can build and act as a ‘lightweight, stand-alone, executable package’. This allows us to combine tools such as ogr2ogr from GDAL (for geographic data format translation) and Tippecanoe (for GeoJSON to vector tile translation) and harness there functionality into a streamline pipeline that works across platforms (Windows, Mac, Linux etc).
A Worked Example
Let’s say we took the TQ tile from the Ordnance Survey Open Map Local Dataset and we wanted to make some Vector Tiles for the woodlands layer of the data set.
Our first prerequisite step would be to setup Tiler. As long as we have docker installed, we can clone the repository Tiler repository, change to it’s created directory and then do docker build -t tiler . inside of it. This will build our docker image.
Once this is complete we can look at converting the data to WGS84 with the OSTN02 transformation file, using Tiler’s bng2wgs84.py script.
We can do this by using ./run.sh --shell and then python bng2wgs84.py some_directory where some_directory is the location of your woodlands dataset (the shapefile). This will create a new file, for example TQ_Building_WGS84.shp.
We could generate that into a set of tiles using a config such as the one shown:
{
    "outdir" : "/tiler-data/tiles/",
    "tileset" : "TQ_Buildings",
    "simplification" : 1,
    "data" : {
        "buildings" : {
            "type" : "shapefile",
            "paths" : ["/tiler-data/input/TQ_Building_WGS84.shp"],
            "minzoom" : 1,
            "maxzoom" : 12
        }
    }

}
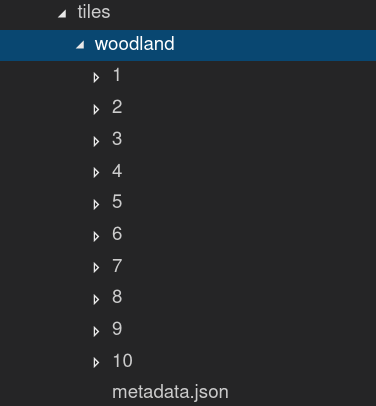
We save this to the configs folder of Tiler as woodland.tiler.json. When we run Tiler from the host (./run.sh woodland) or within the docker shell (tiler woodland) it will produce a set of vector tiles in the /tiler-data/tiles/ directory of Tiler when we do ./run.sh buildings from the Tiler root directory.
We end up with a set of tiles from zoom level 1-12:
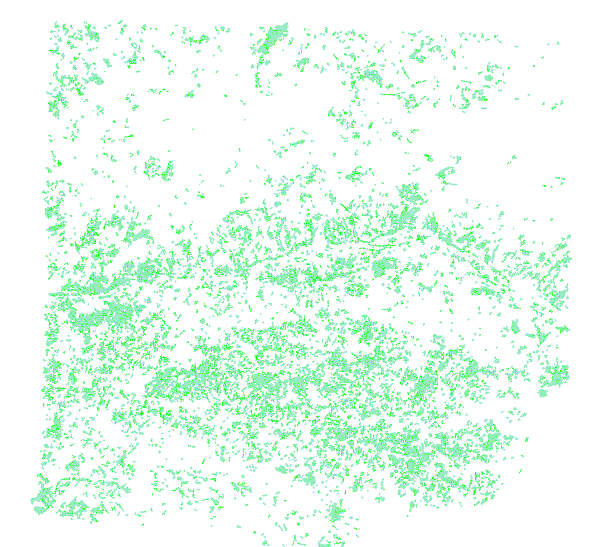
If we pointed a vector tile map client such as Mapbox GL at the local tiles, and we applied some styling in the code, we can get them to render as such:
Conclusion
We hope that Tiler will be of use to other teams or individuals looking to make vector tiles out of their data. If you’re interested more, try cloning and trying the example in the repository. Also feel free to keep an eye on the repo for more updates and developments!

Leave a Comment