
My Experience at Geovation
Johann RajakarunanayakeI started my role at Geovation as a Graduate Software Developer. Over the past year and two months, I have gone from having very little coding knowledge to being able to create interesting projects manipulating map data in real world situations. I also learnt how to make my code simpler, and more readable, increasing the efficiency of my projects.
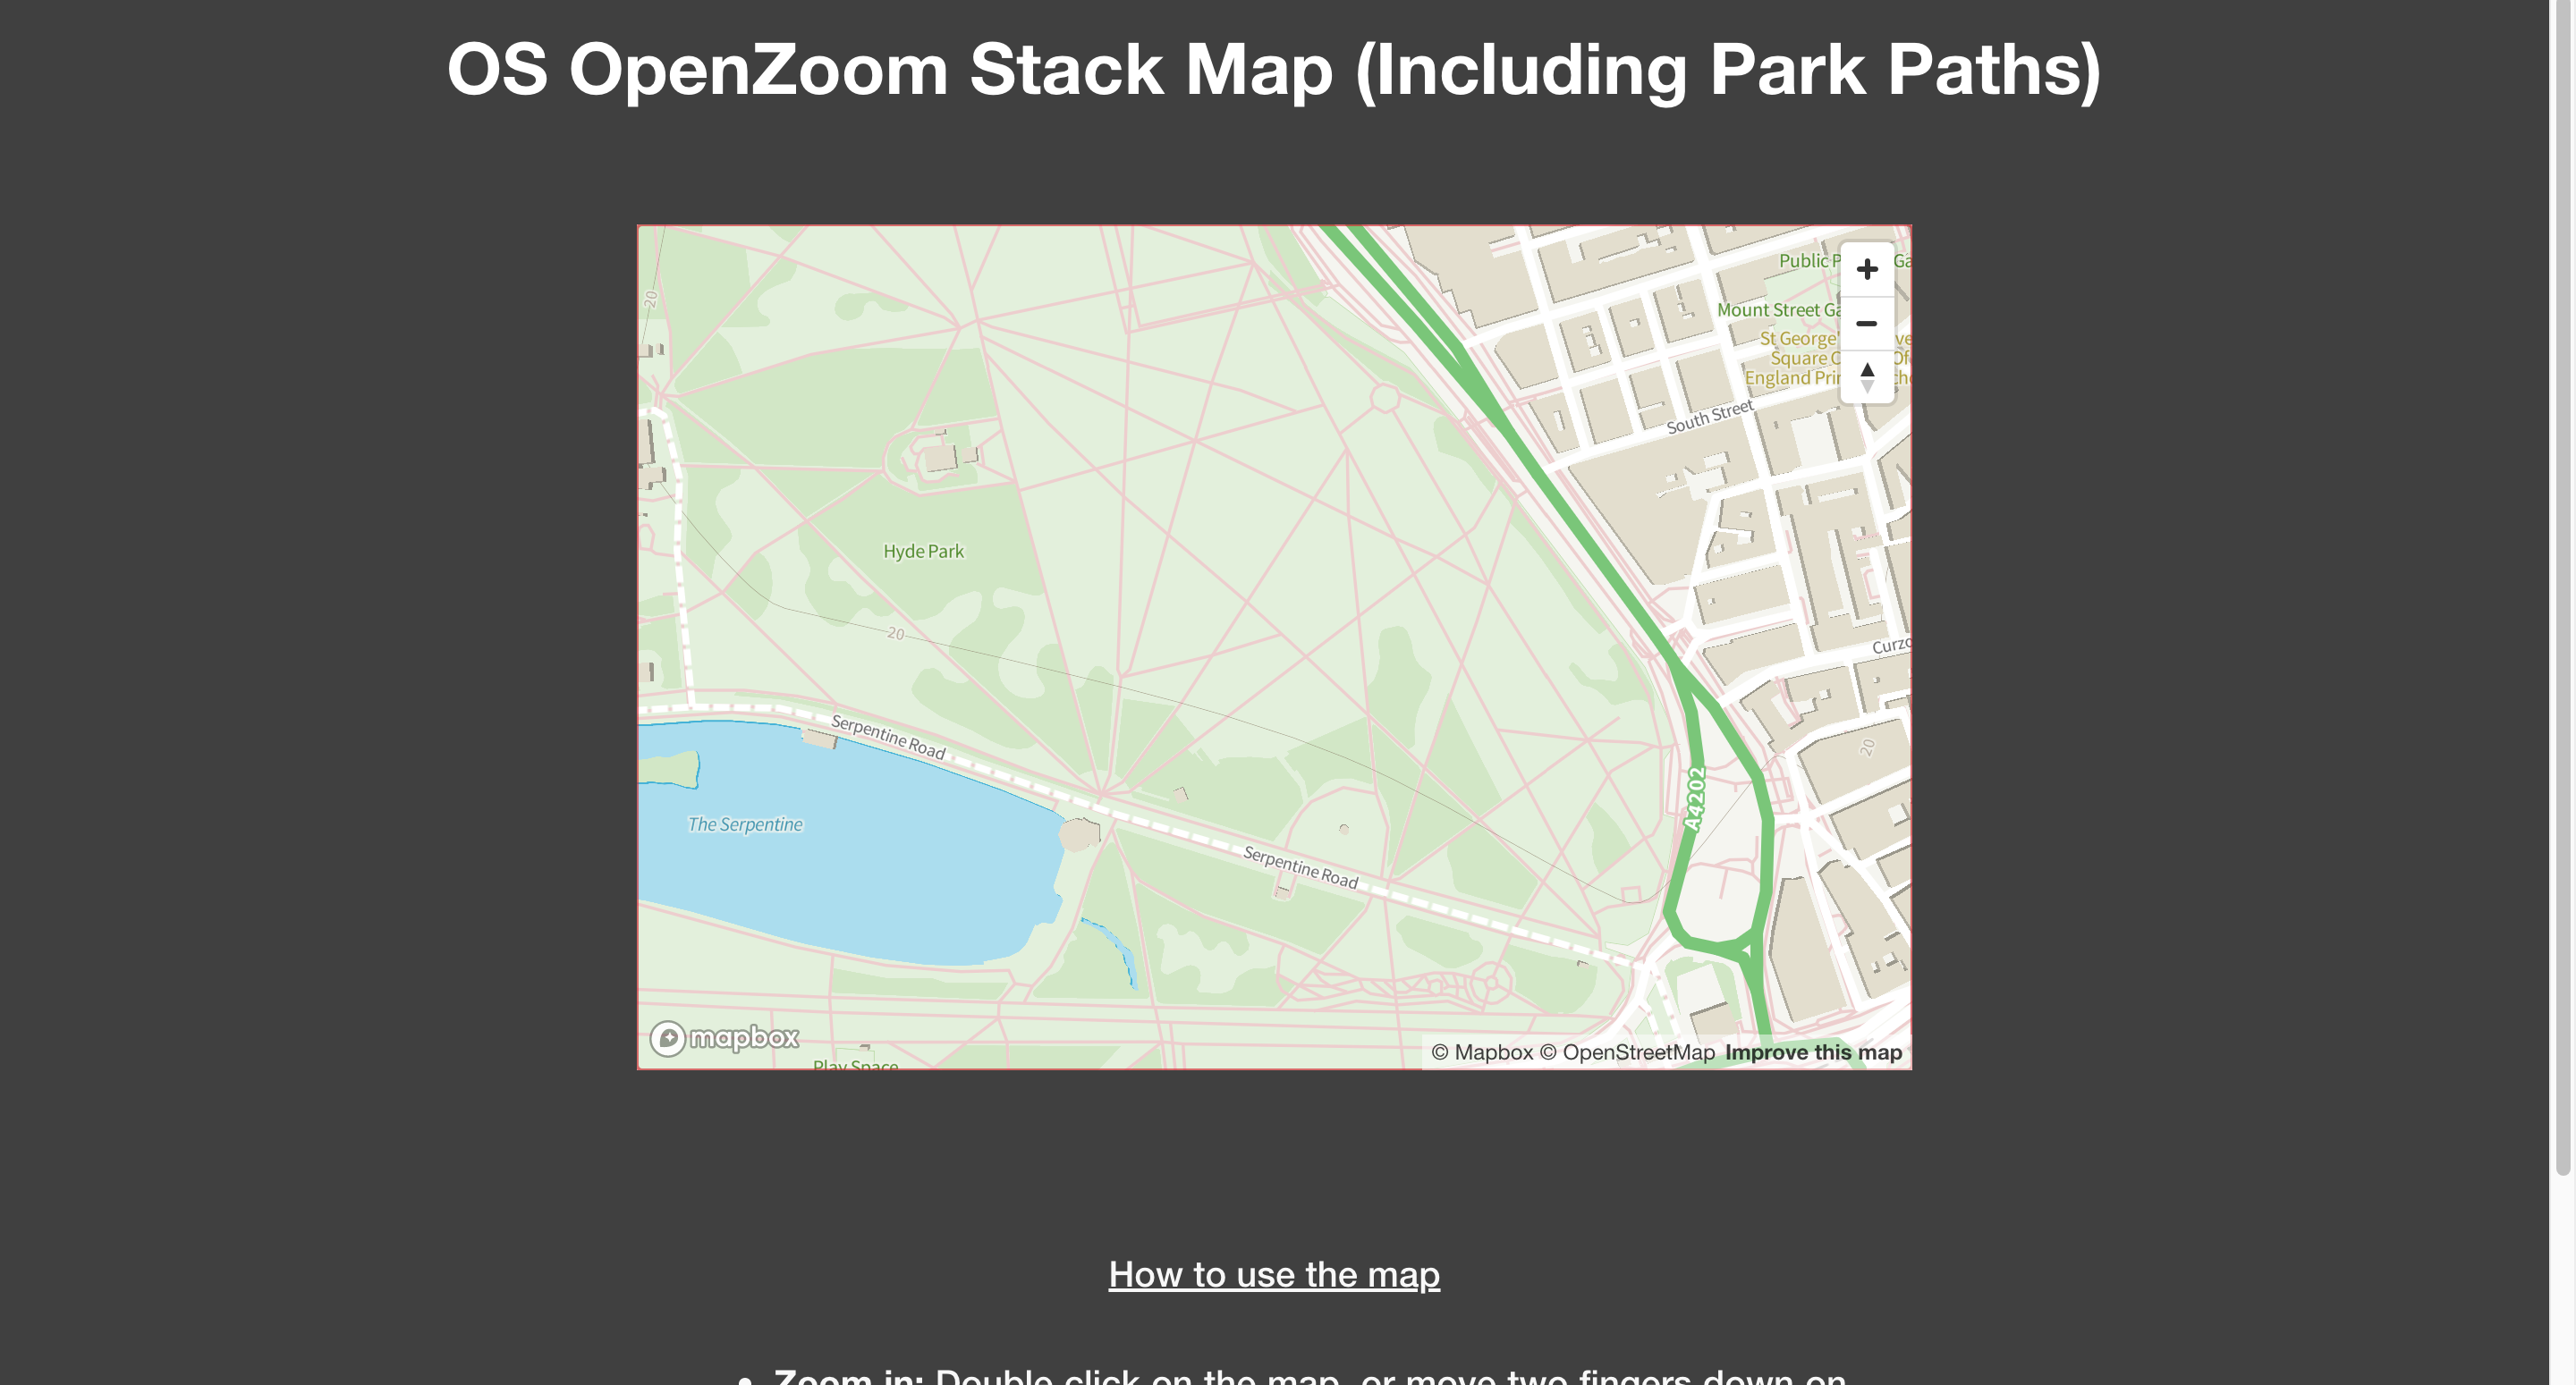
My general role was to create projects using products from OS in order to test them, then review these projects by writing blogs, highlighting positives as well as improvements to their service. My first project was a fairly simple project to add park paths using Mapbox for OS’s Zoomstack product.
I spent a large amount of my work testing features from the OS Datahub API, which was still in its trial version, and giving feedback before the official launch. The main challenge was to create effective hypothetical scenarios, in order to test the features accordingly. All these projects were added to the Geovation sandbox, which you can find here.
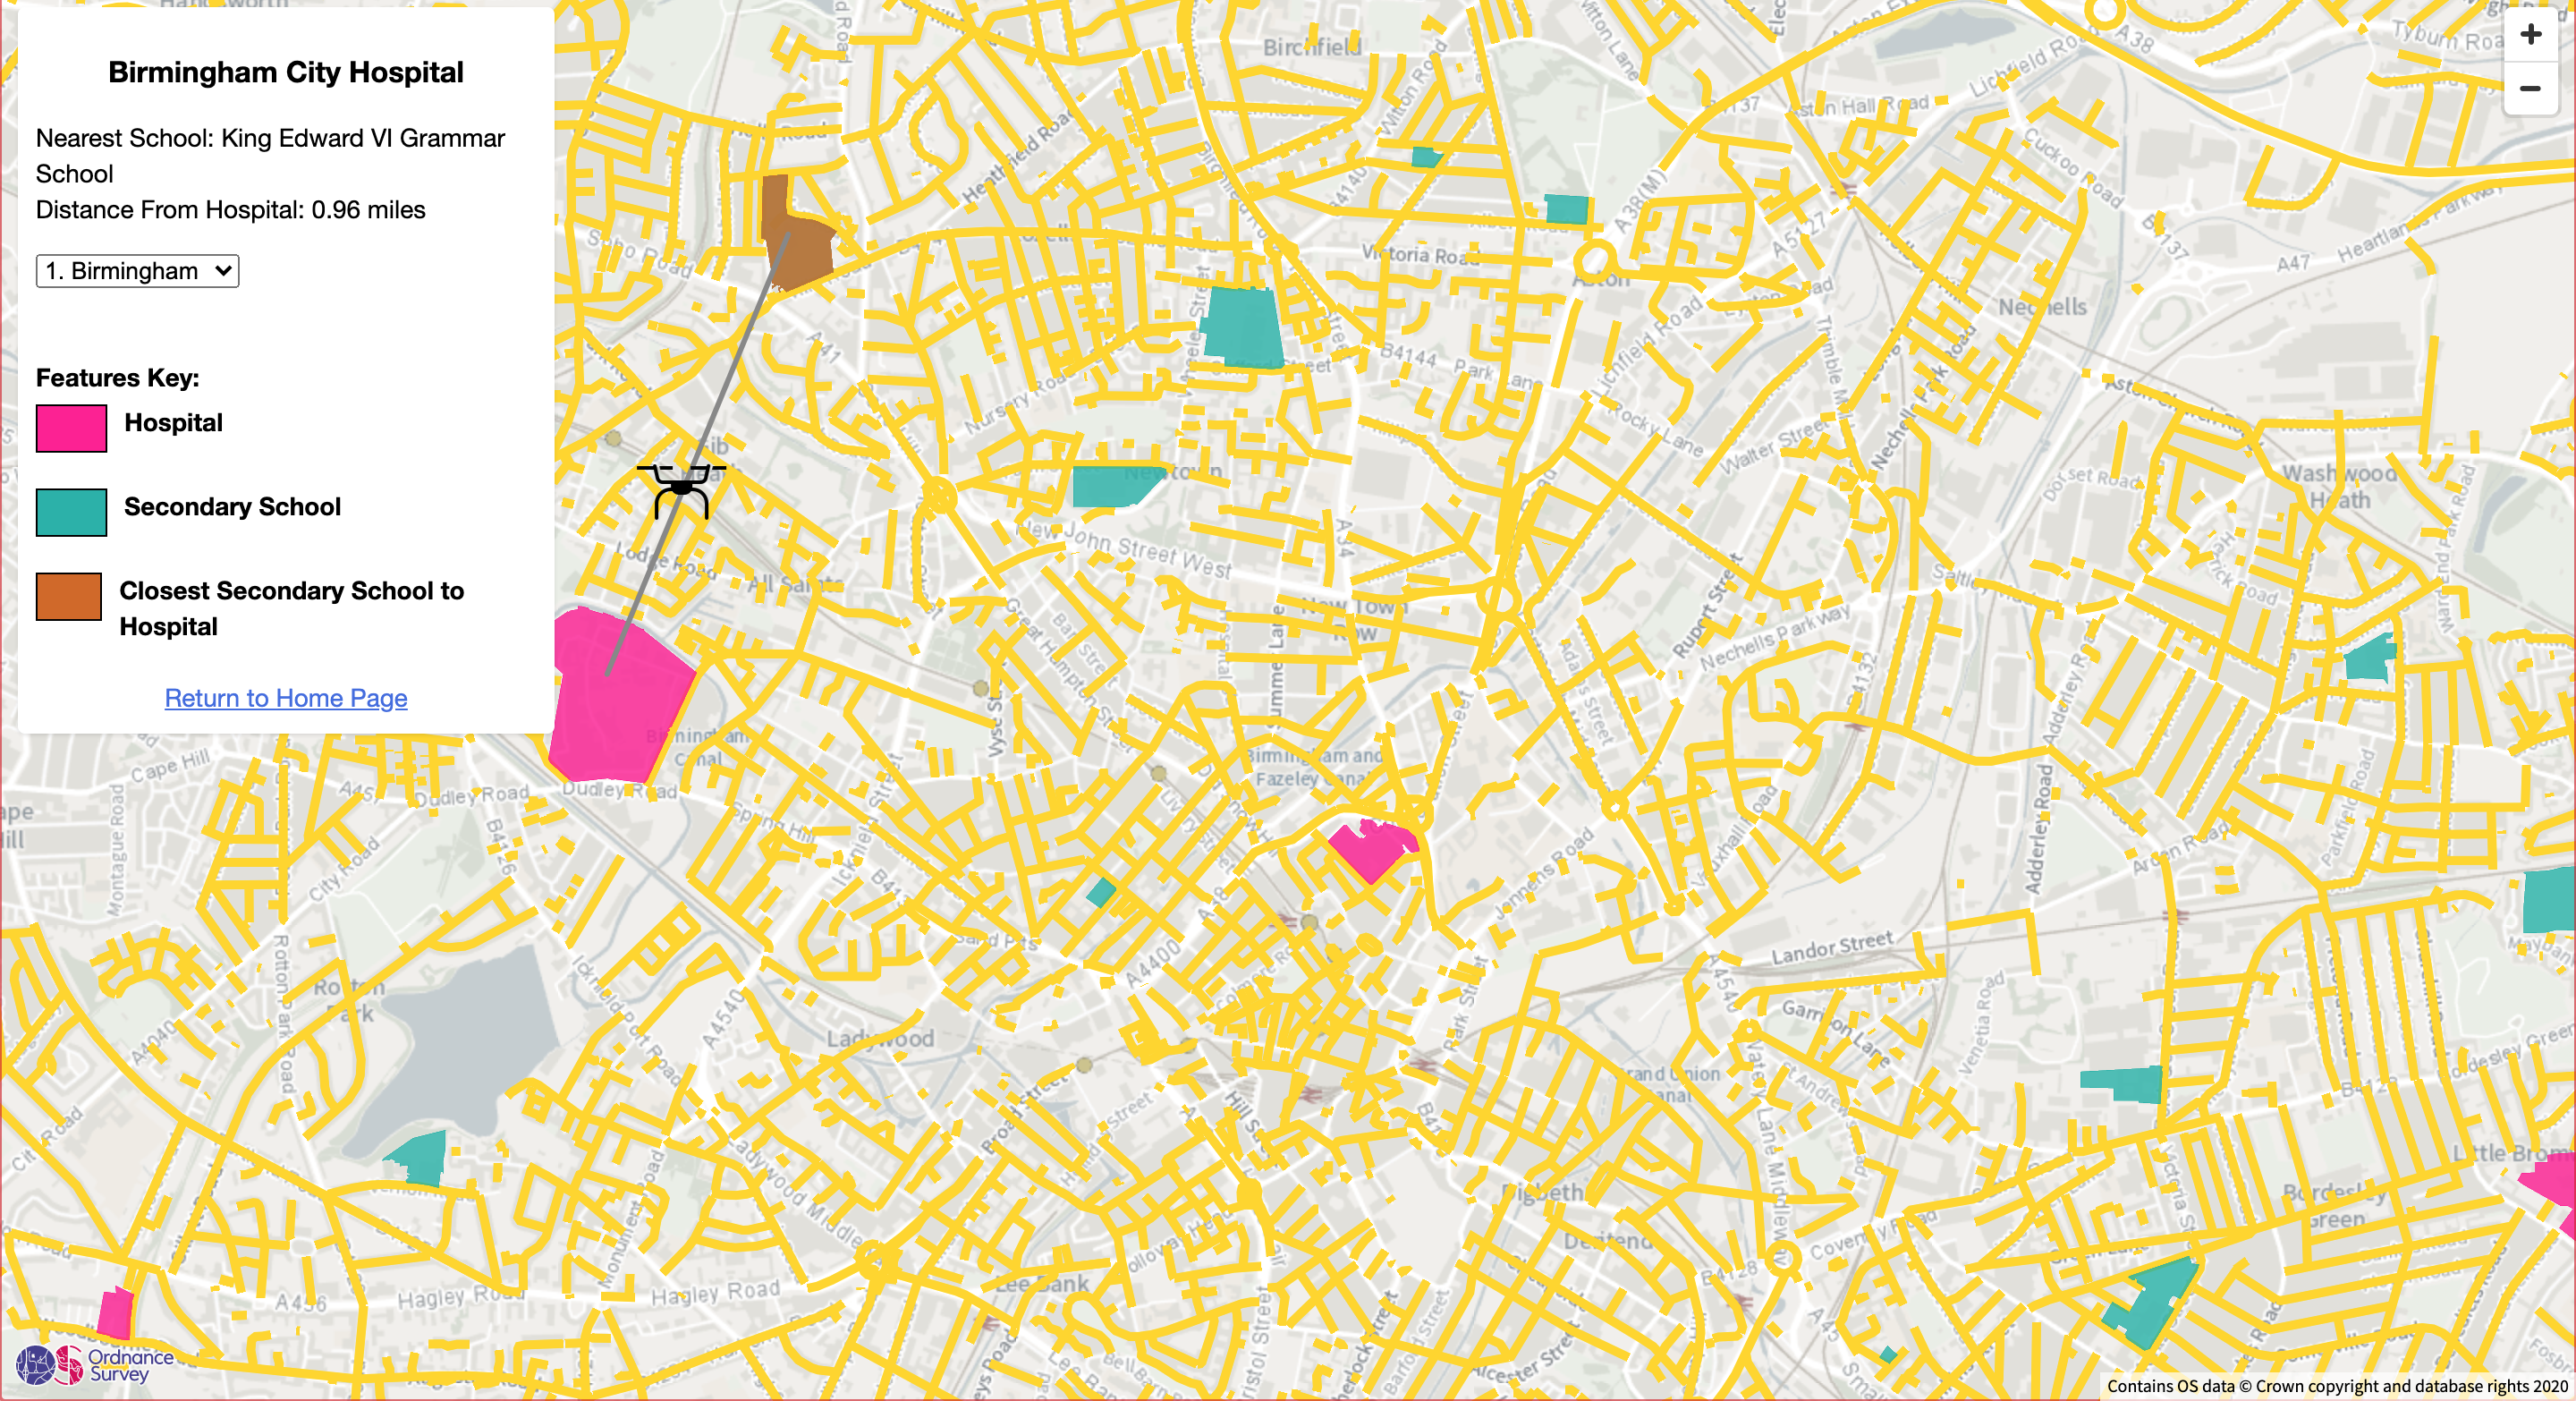
One of my favourite projects from the sandbox page was a coronavirus related project, showing the nearest secondary school to a hospital in the hypothetical case of hospitals getting full.
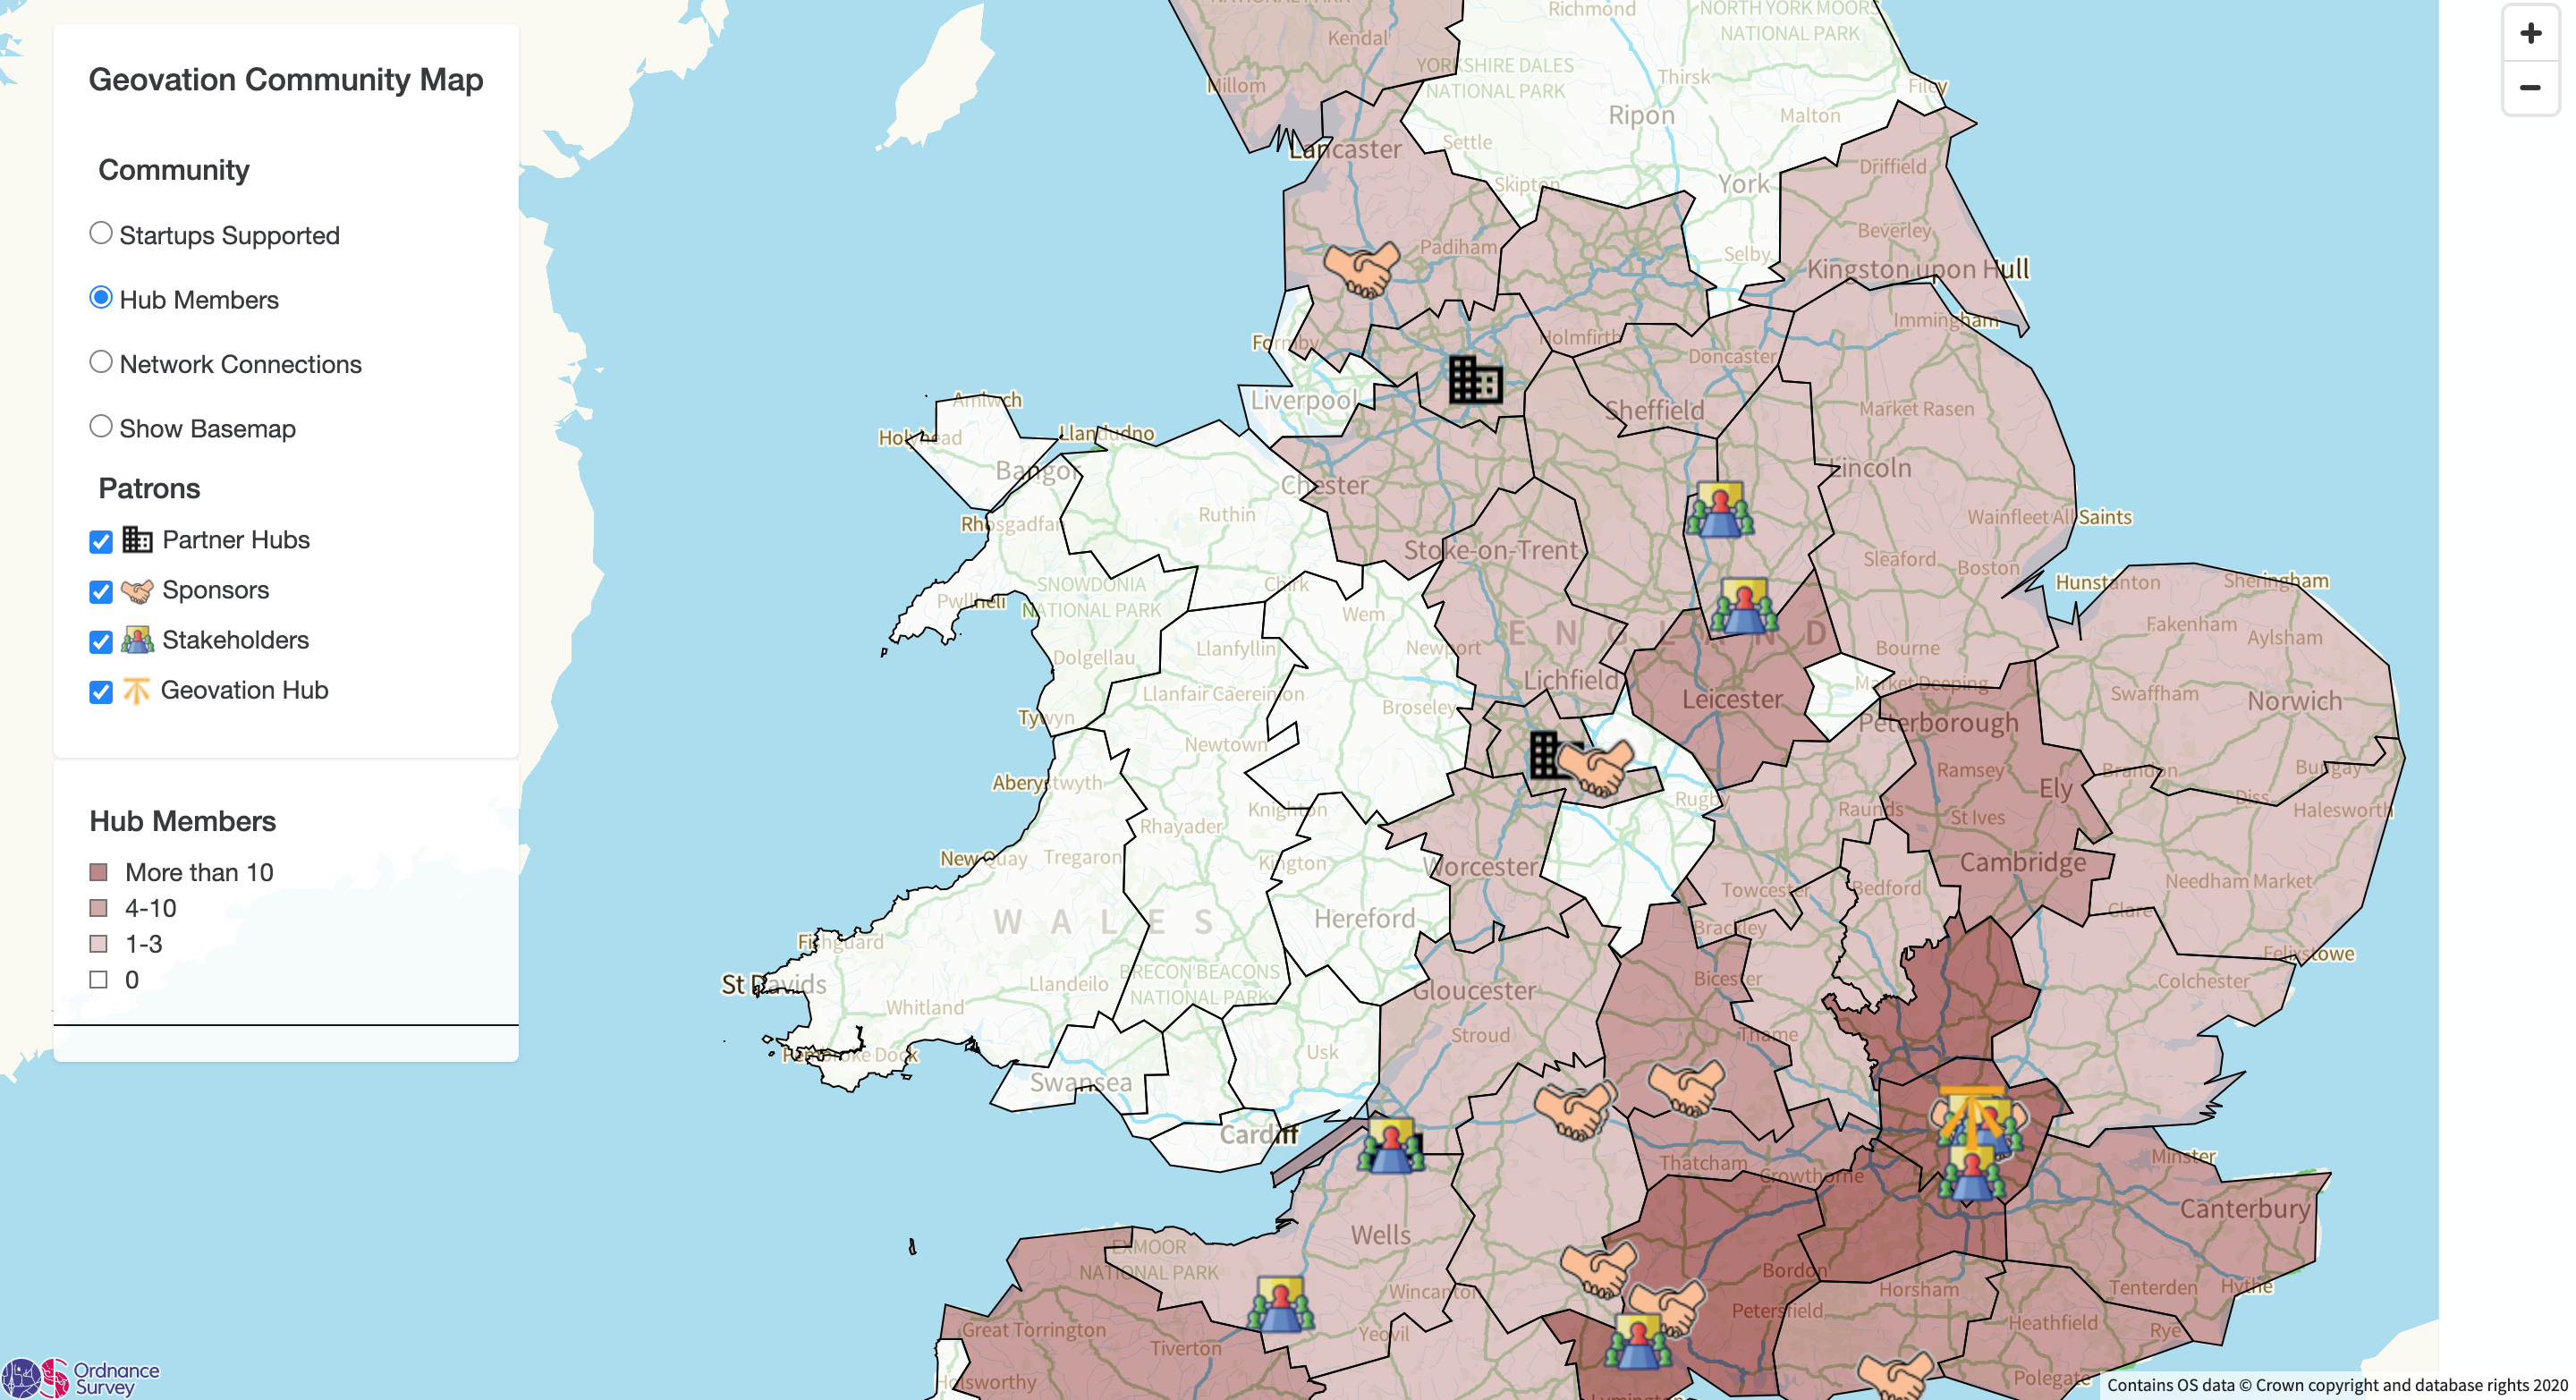
In addition, I provided support for the Geovation team with insights by creating the Geovation Community Map, which the team can use to identify areas where Geovation can attract more startups, network connections and hub members. This will be a useful tool for the team to help the focus on certain areas in the future.
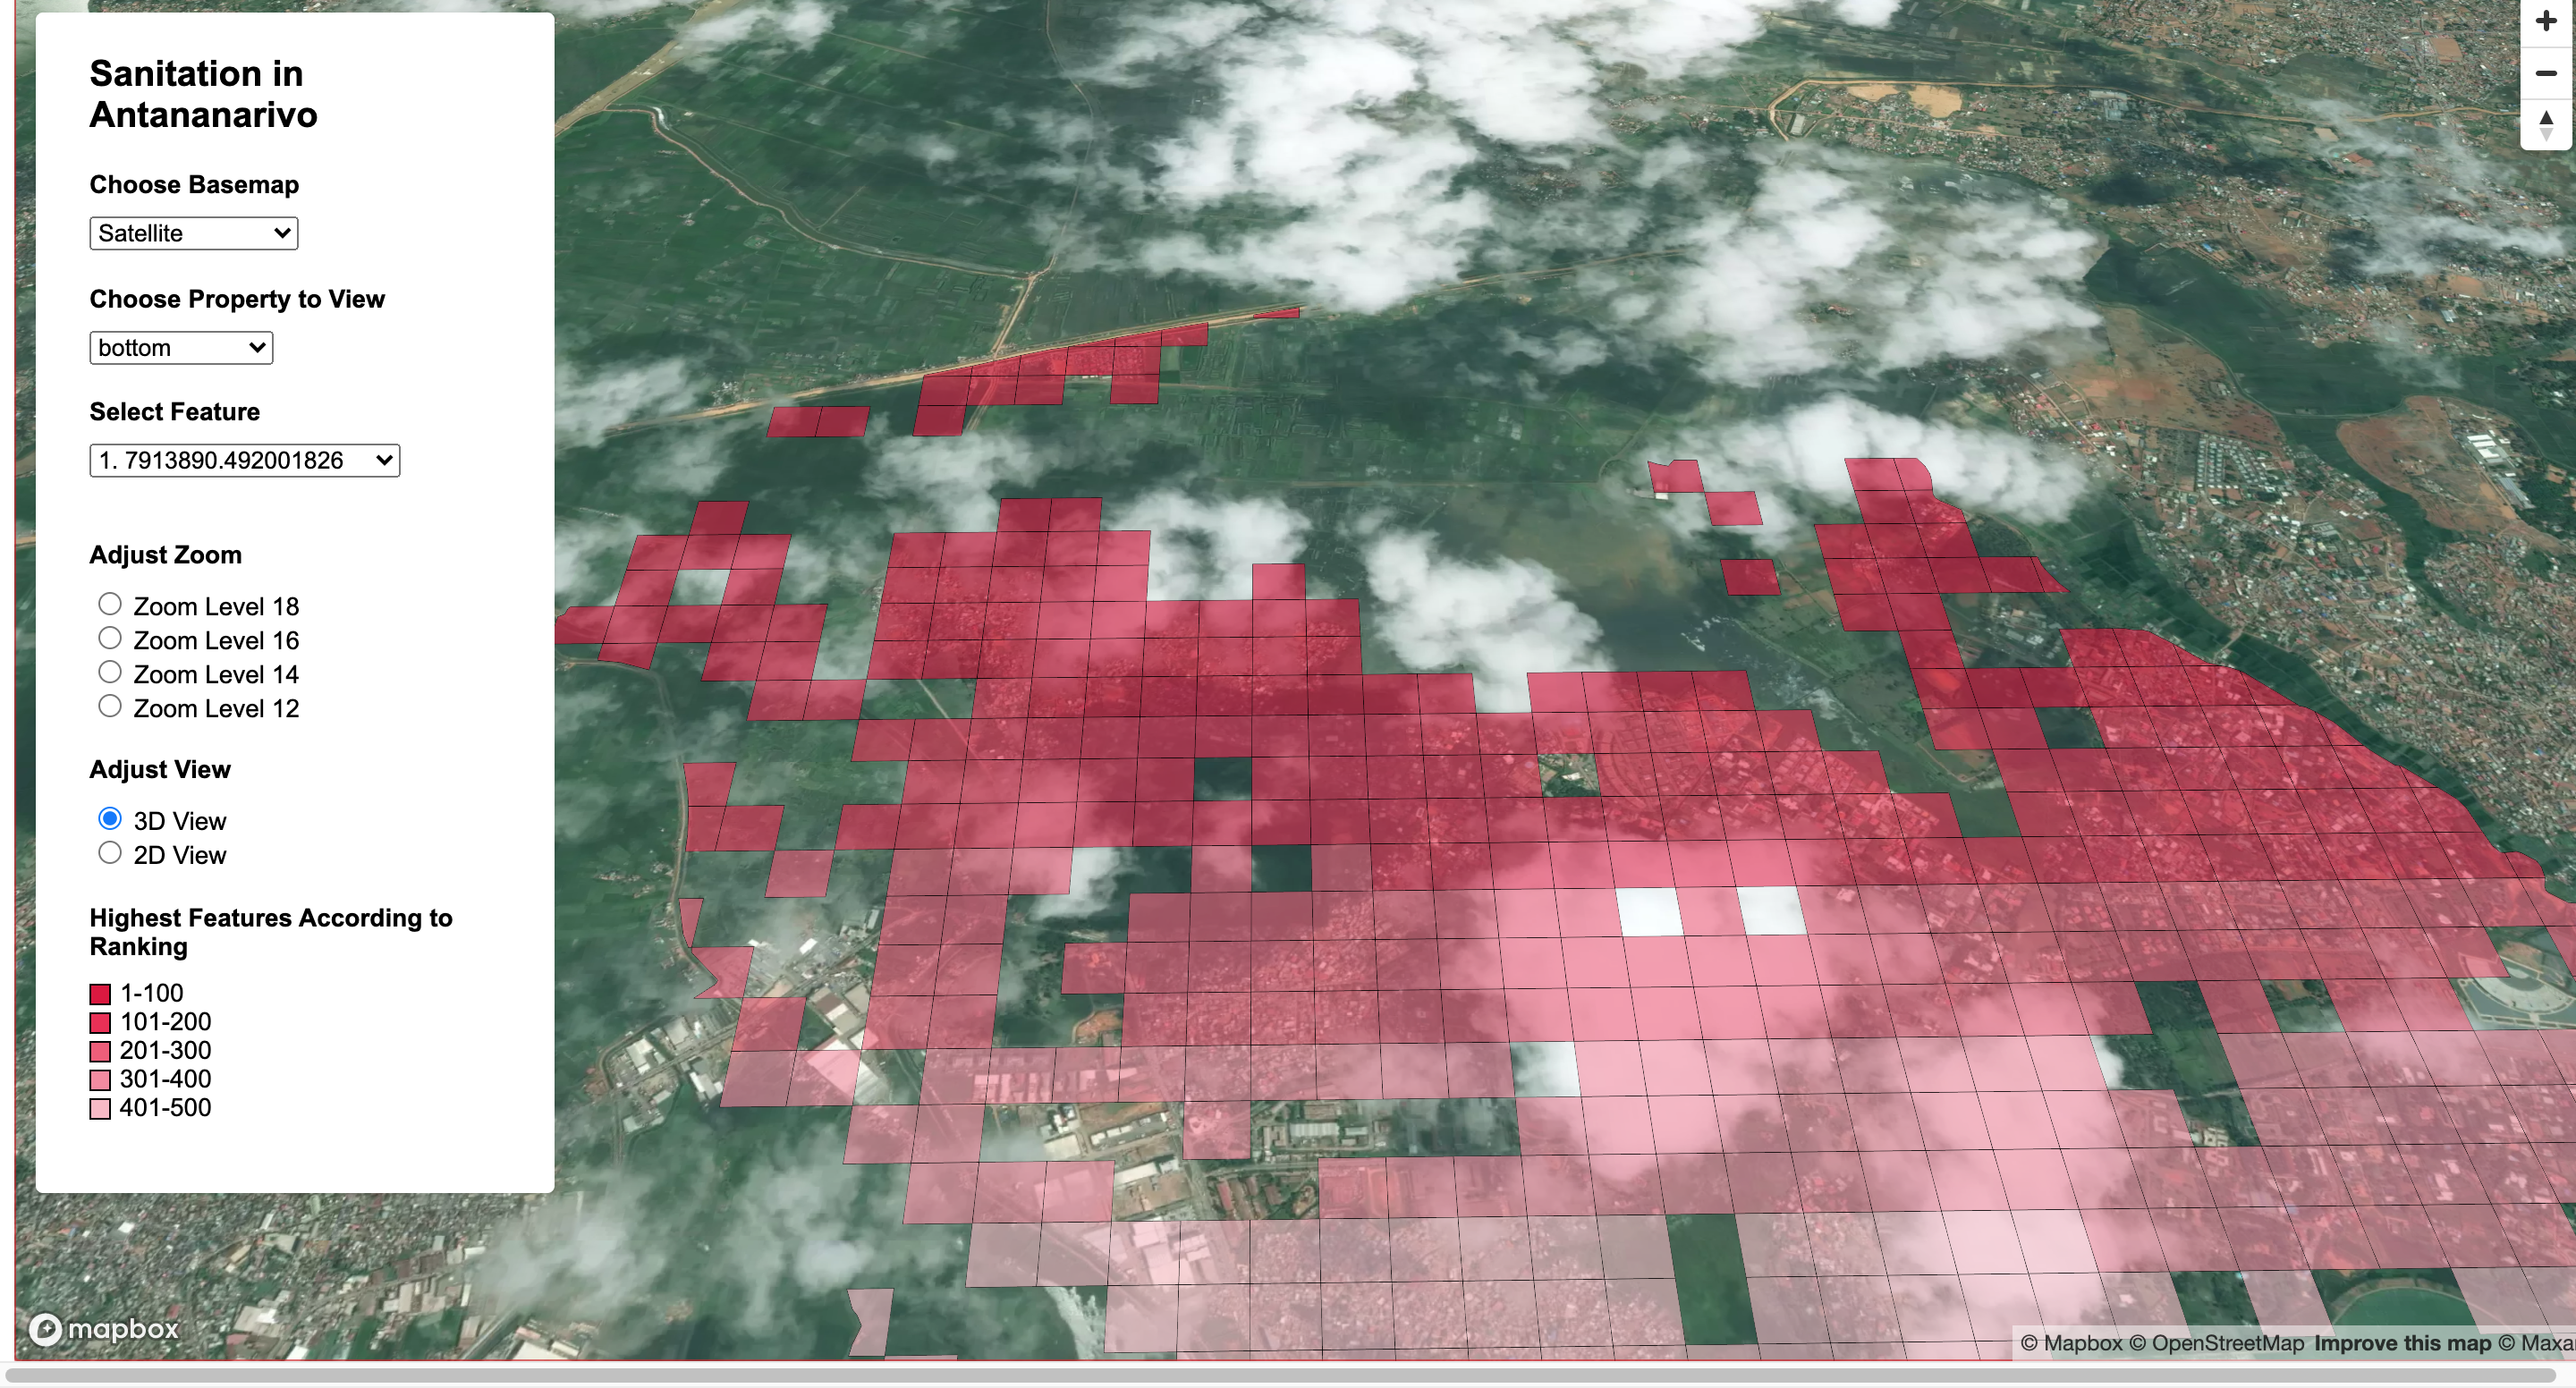
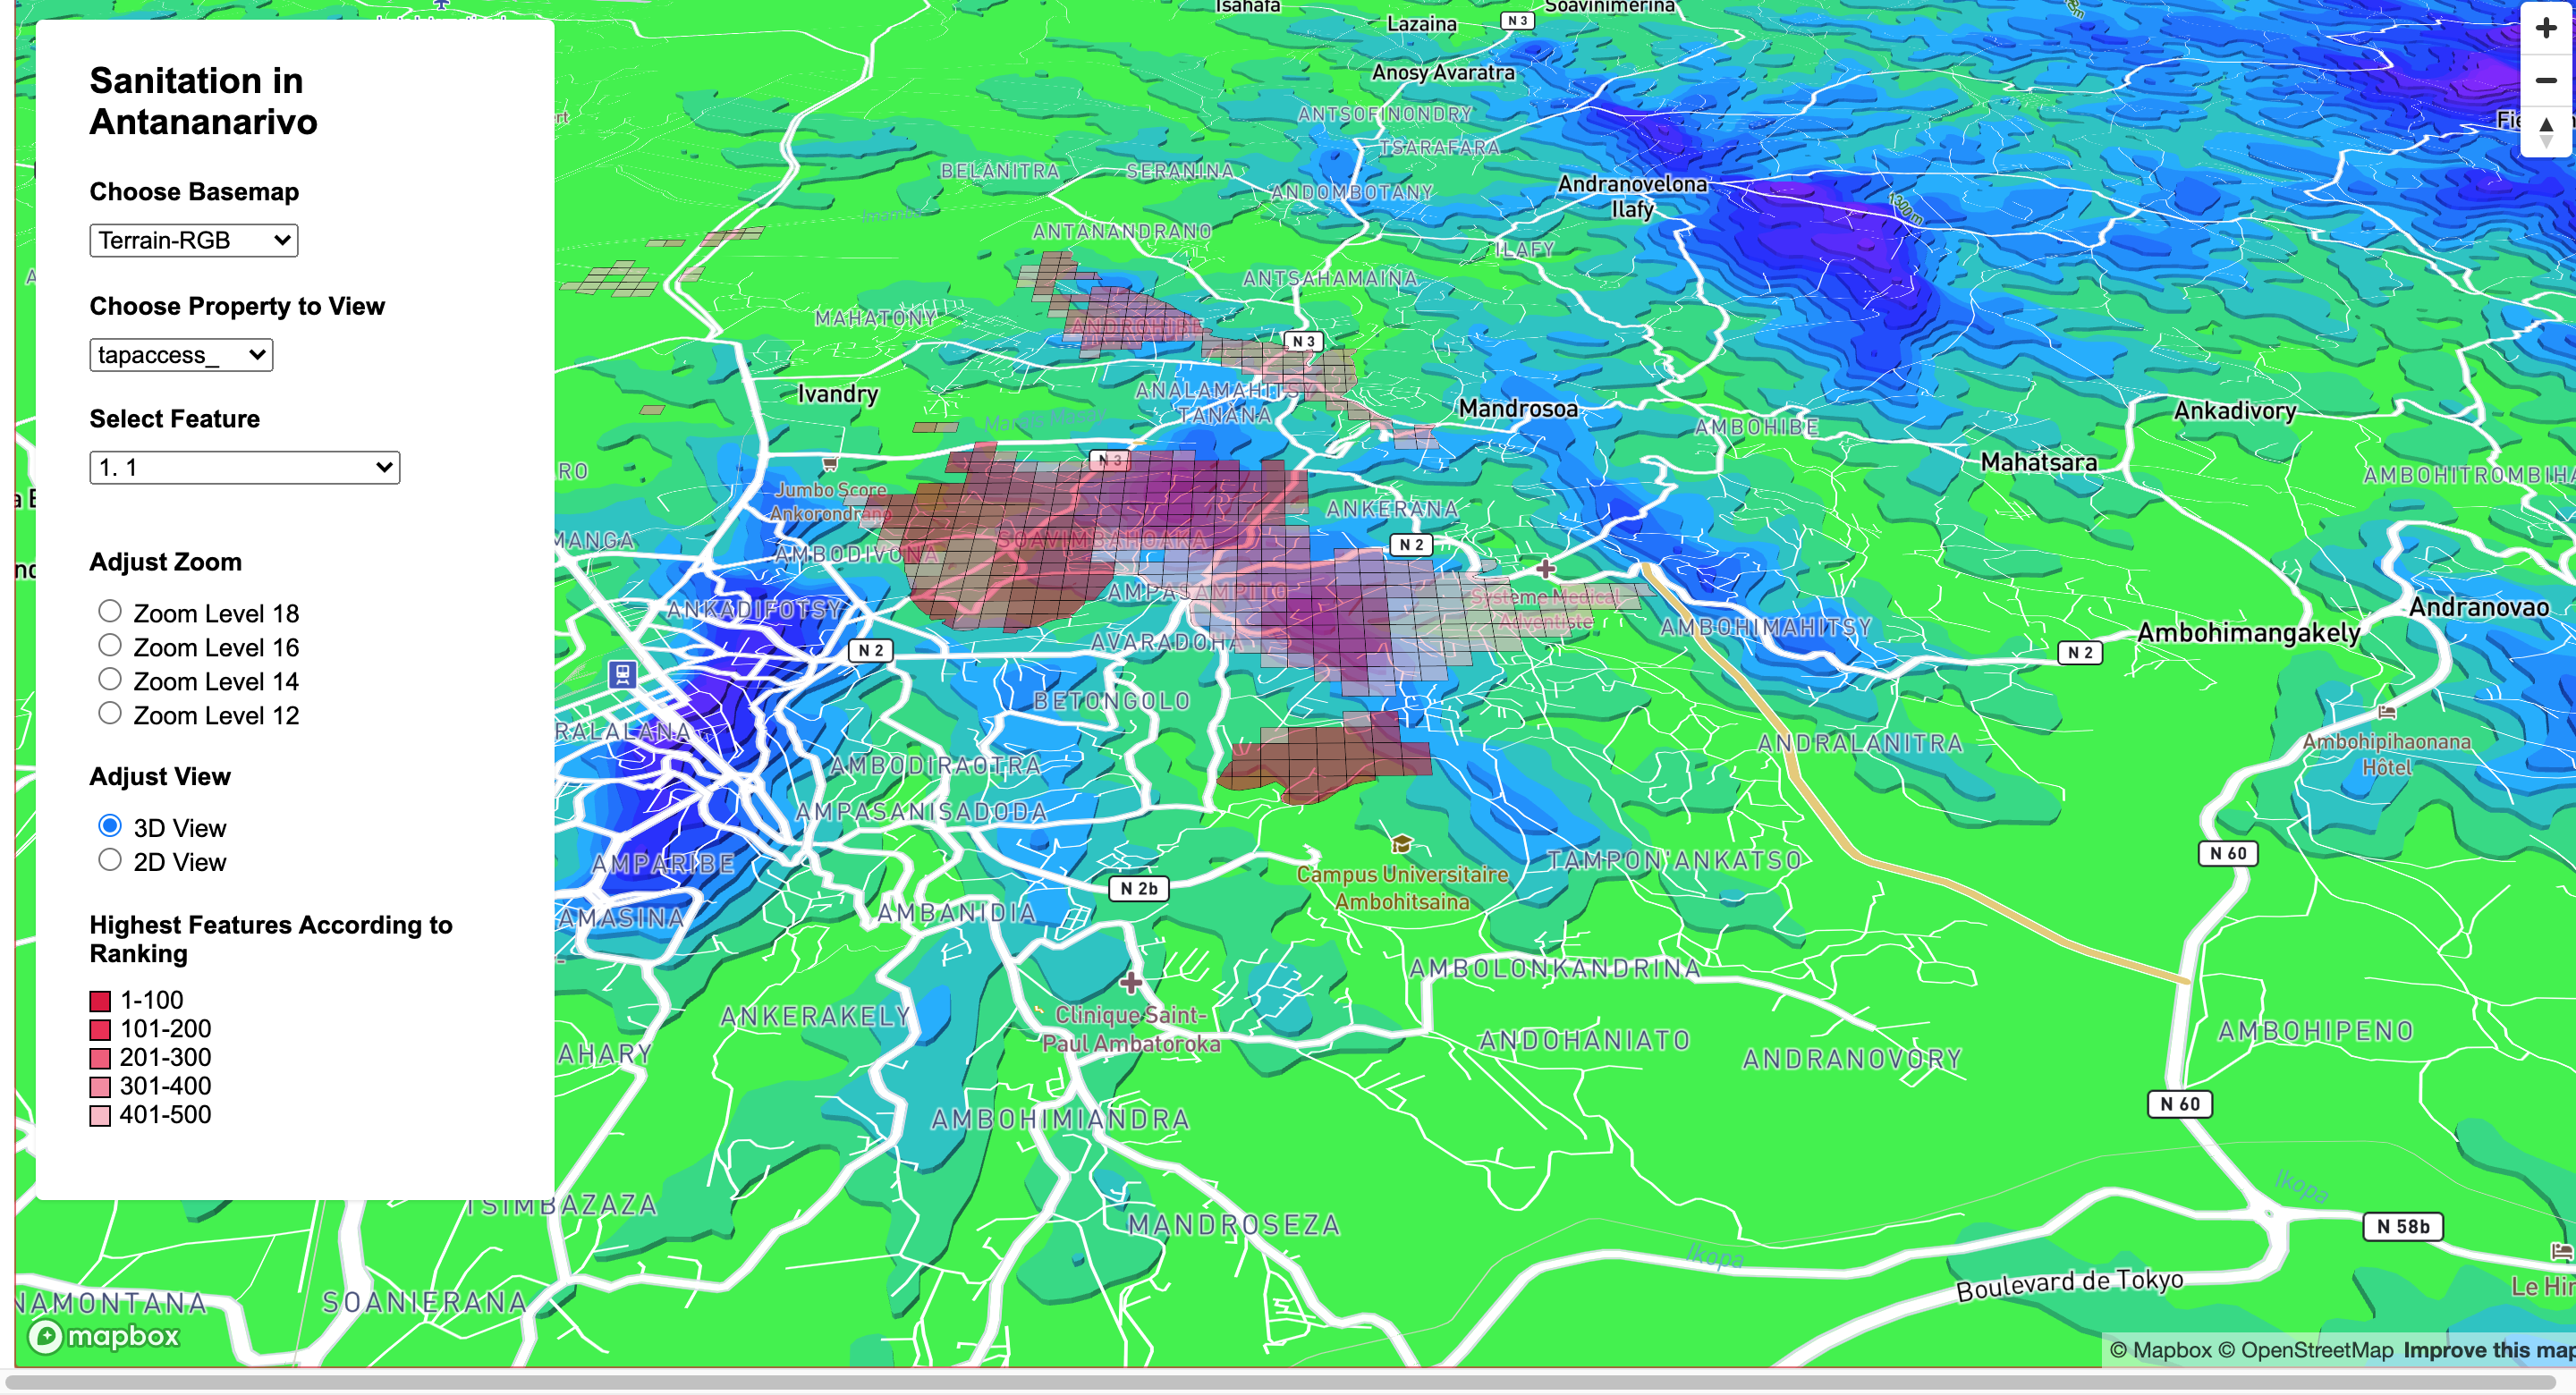
Towards the end of my role, I had the opportunity to support Geovation member Gather, and create a map for them showing different features in Antananarivo, whilst toggling different properties and maps. I even customised my own map layer with Mapbox which shows the different contour heights!
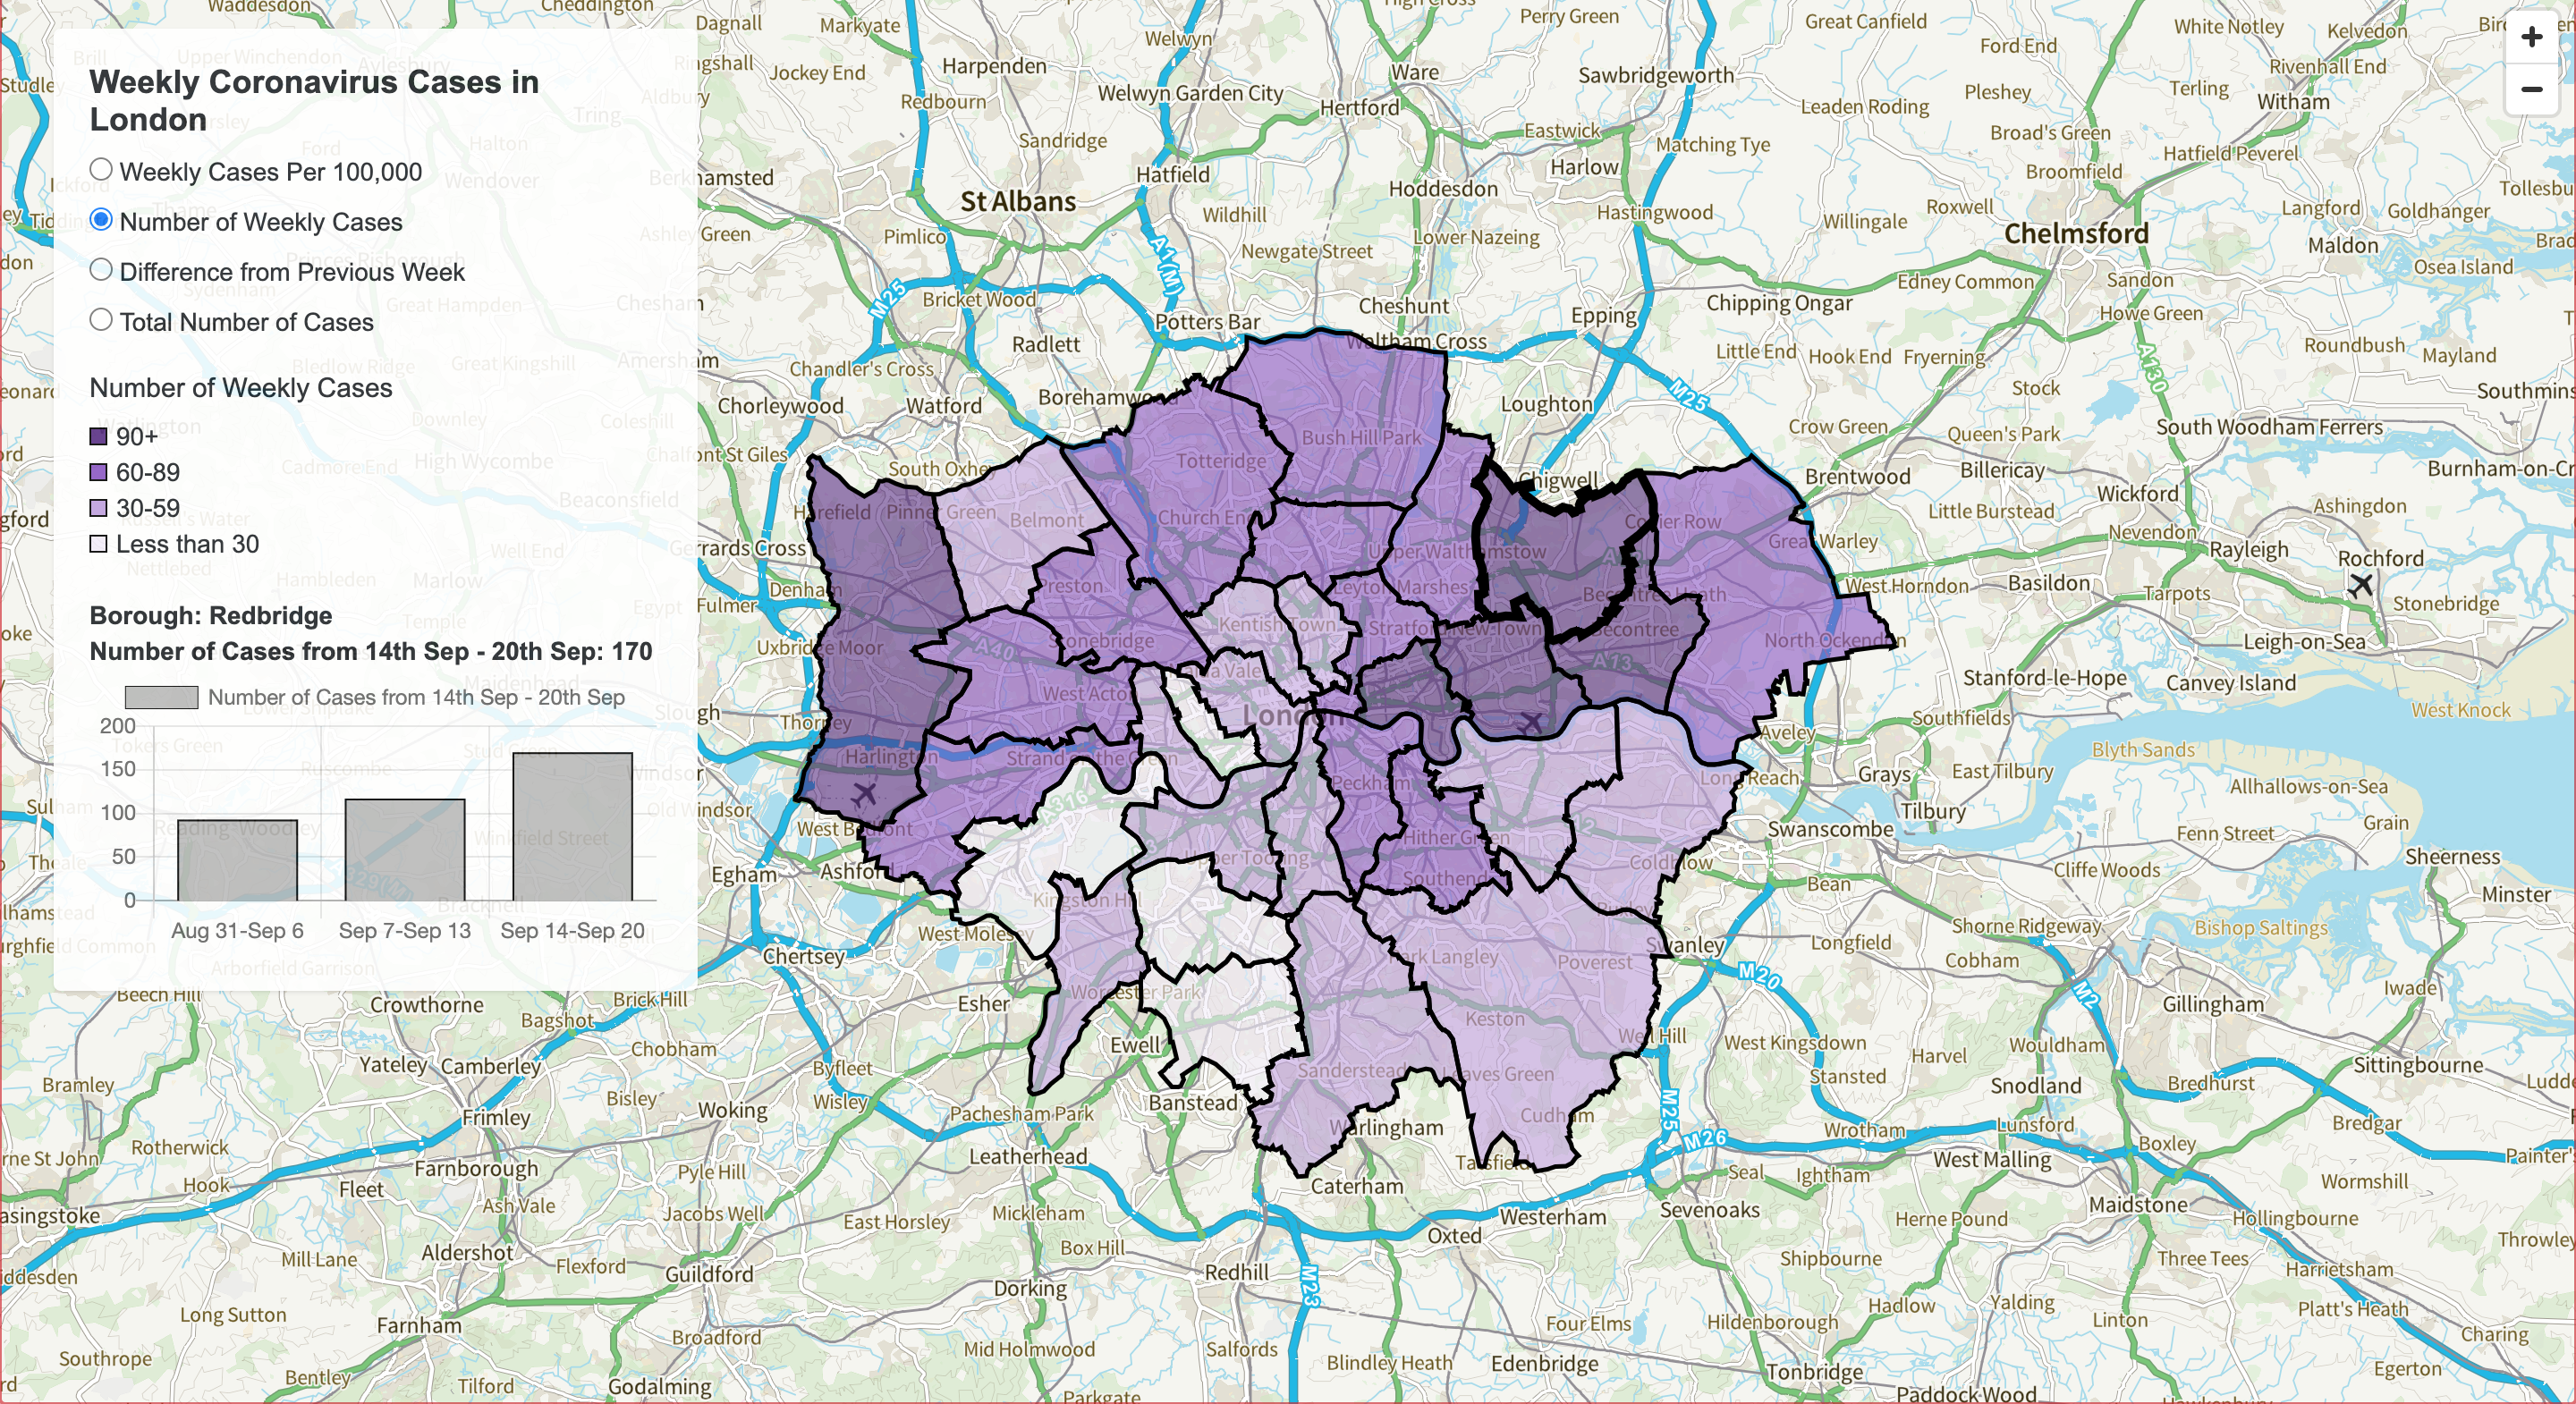
Finally, I created a more recent coronavirus related project as cases were starting to increase from the start of September. One of the main issues I had for checking cases was that there was no website which showed a visual display of weekly local cases in London. The best was Sky or BBC News, which showed numbers, but it was pretty time consuming having to check the cases in all the local areas in London one at a time. So, I decided to use OS Products to create a map visualisation showing the number of weekly coronavirus cases in London, as well as the increase/decrease from the previous weeks. I also used Chart.js to add bar charts which makes it easier for the user to identify particular trends, and whether cases are increasing or decreasing over the weeks.
Beyond my role, I found my experience at Geovation very eye opening. I was lucky enough to encounter several start-ups and hard-working, creative minds, as well as the variety of things they were doing. When the hub was open, I always wanted to take the opportunity to speak to different people, get an insight into their start-ups and what they were about, and provide any help or support to them if I could. With the experience and knowledge of our engineering team, I was able to learn a lot, and although at times my role was challenging, it was something I thoroughly enjoyed.
I would like to thank Sebastian for his mentoring and support throughout my time, as well as the rest of the engineering team, and the wider Geovation team. You have all helped make my time here a pleasurable experience, and I will be looking forward to meeting you all again in the future!

Leave a Comment