
It’s a wrap!
Paul NebelEvaluating Markets
Most of the posts I’ve written are based on opinion and somewhat abstract so I thought I’d give you something more practical. In my last post I wrote about the importance and advantages of finding your niche. Why are niches important? I’ll let Paul Graham (co-founder of Y Combinator) summarise:
You can either build something a large number of people want a small amount, or something a small number of people want a large amount. Choose the latter. Not all ideas of that type are good startup ideas, but nearly all good startup ideas are of that type.
One of the things I advised you to do is to check the potential size of the market. I’m going to give an example here of how to do this using just the internet.
I recently gave an all-day seminar at Tramshed Tech about ‘Idea Generation and Product Development’. One of the attending companies was interested in the possibilities of vehicle graphics and for no particular reason (other than that I know absolutely nothing about it) I decided to investigate the vehicle graphics market.
Step 1: Web Traffic
Let us suppose you have identified a potential market niche and want to investigate it further. Where do you start? First and foremost you need some idea of the potential size of the market in order to judge whether it is worth persuing. A relatively simple way of doing that is to look at the amount of web traffic generated by search terms related to it.
A good first step for this is the Google Ads keyword planner tool. This is a free tool that, among other things, gives you an idea of the average number of monthly searches for any keyword in the country of your choice (in this case, all my searches were based in the UK). It also provides a range of Cost Per Click bid prices that may help you get your site to the top of the first page of search results for a particular term.
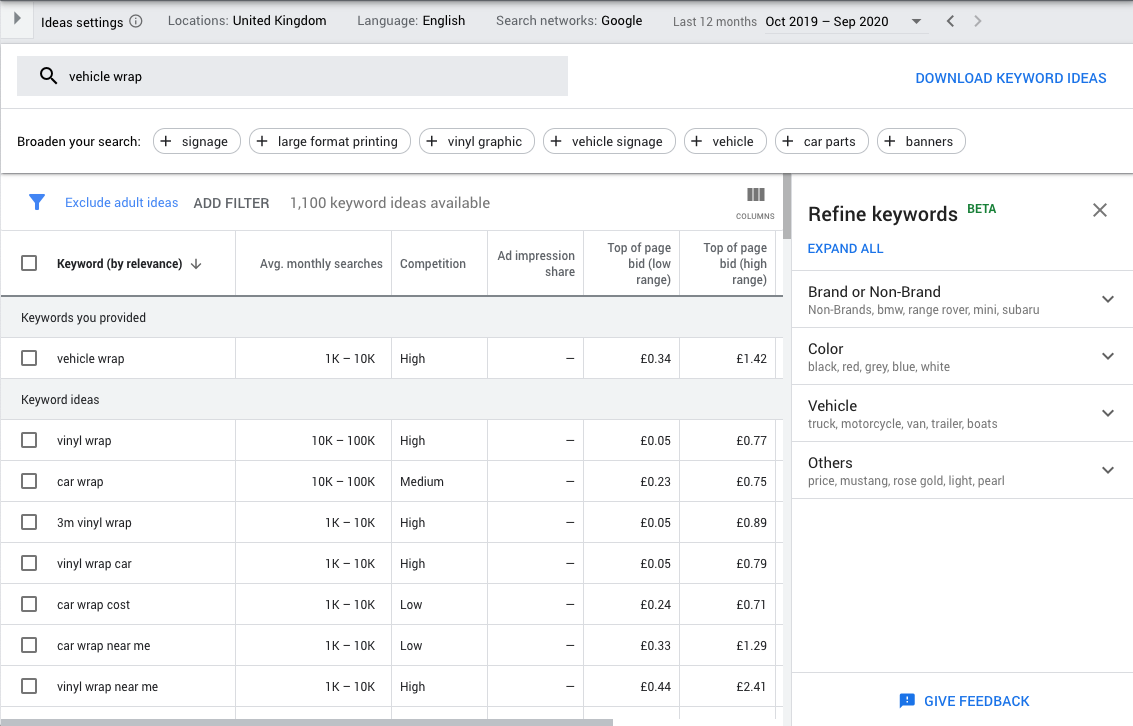
I started with the keywords vehicle graphics and noticed the term wrap in a lot of the results. Since ‘vehicle graphics’ is more generic than ‘vehicle wrap’ I decided to focus on the more niche keywords vehicle wrap. The results for ‘vehicle wrap’ were as follows:
 |
|---|
| Figure 1: Google Ads - keyword ideas tool |
- vehicle wrap:
- 1k - 10k searches/month.
- High competition (that is to say, there are many competitors bidding for these keywords).
- ‘top of page’ bidding range £0.34/click - £1.42/click.
- car wrap:
- 10k - 100k searches/month.
- Medium competition.
- ‘top of page’ bidding range £0.23/click - £0.75/click.
- vinyl wrap near me:
- 1k - 10k searches/month.
- Low competition
- ‘top of page’ bidding range £0.44/click - £1.79/click.
In an attempt to become more niche and move into an area of low competition I decided to run a quick search on vehicle wrapping near me. Unfortunately it didn’t yield any useful results, with companies located in Warrington, Chesterfield and Michigan(!) appearing in the first page - I live in London, so none of these were actually anywhere near me (especially not the results from America).
I refined my search to vehicle wrapping near me london uk. The first result was https://vehiclewrapsuk.com/. I used this website to try to find out what kind of web traffic the number one result receives. My search didn’t yield any results, however, as sitechecker states they need more than 10k visits/month to get useful metrics. This isn’t really a surprise since Google tells us that there are a maximum of 10k searches per month, but it was useful to check.
I didn’t want to rely solely on Google for my results, and I found several blog posts that supported this decision. This site, for example, had conducted research indicating that Google Ads keyword planner estimates are 200% lower on average than actual cost of a live advert!. In the case of telecommunications, the planner estimated costs 826% lower than live costs.
They also give some useful information about how to reduce keyword costs which I’ll leave you to investigate at your leisure.
The fact that Google seems to underestimate advertising bidding costs is not really that surprising: Firstly, it is in Google’s interests to make costs seem lower than they actually are; secondly, the site states that bid costs are based on historical bids, not current bids, and that actual bid prices may vary.
With this in mind, perhaps it’s worth getting some kind of second opinion. This site provides some useful, independent, metrics on keywords. Entering the search term vehicle wrap here yields what appear to be similar but lower traffic values but the site itself admits that it doesn’t track all searches in the same way that Google does. However, the results for Moz.com are as follows:
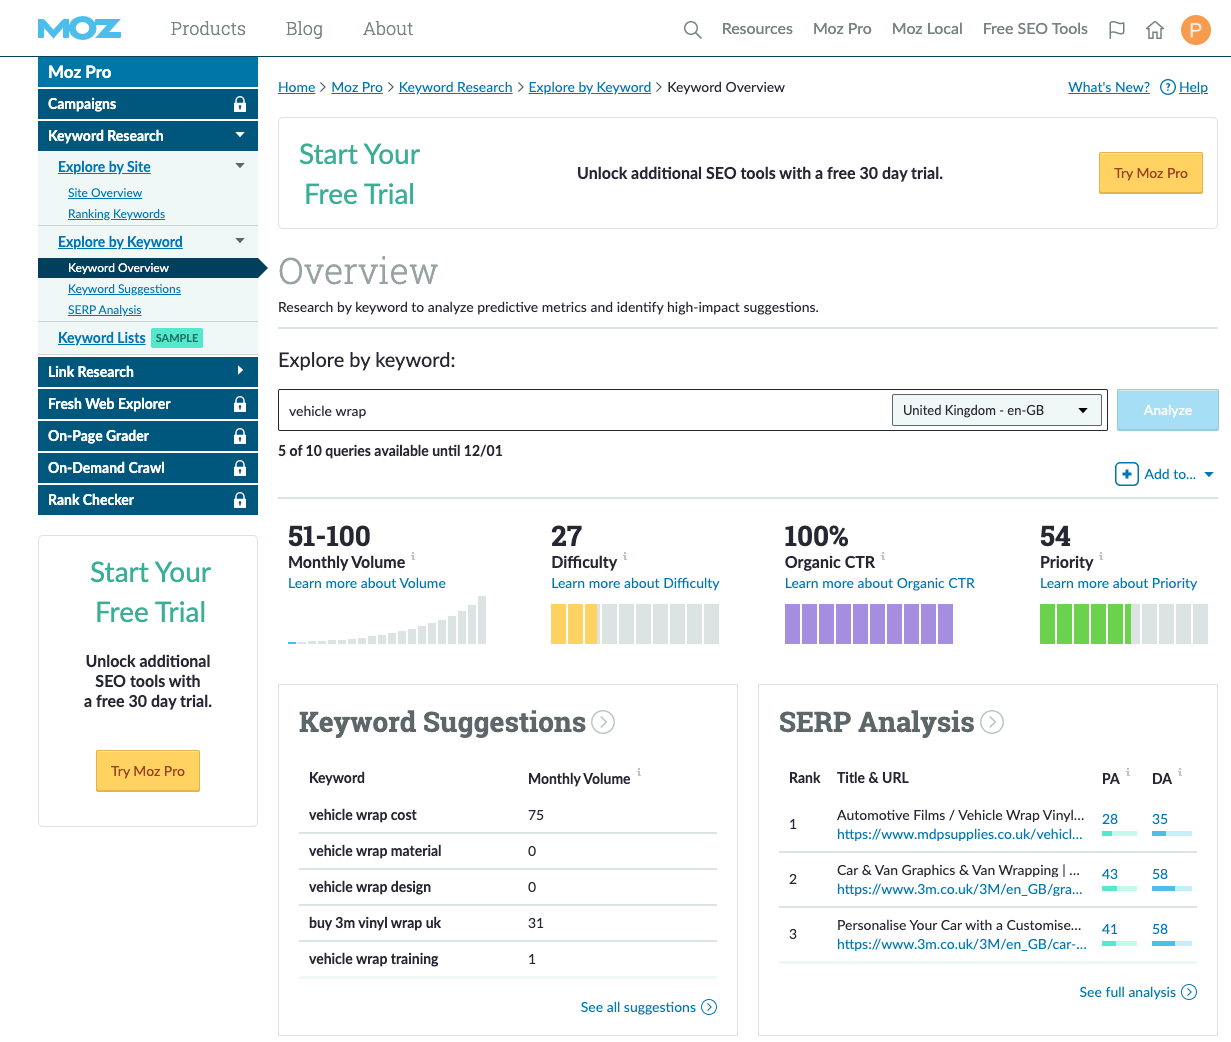 |
|---|
| Figure 2: Moz.com - keyword ideas tool |
- vehicle wrap:
- 51 - 100 searches/month (significaltly less than Google Ads figures)
- Difficulty 27/100 (0 = easy, 100 = hard, defined as how difficult it is to rank higher than current competitors on first page of search results - similar to Google Ads ‘competition’ rating)
- Priority 54/100 (0 = low, 100 = high, a higher value indicating a sweet spot of low difficulty and higher volume)
Looking at the keyword suggestions tool on Moz.com, vehicle wrap ranks 15th at 66 searches/month whereas car wrapping yields 1,182 searches/month and vehicle wrapping near me 101 searches/month.
Who is correct, Google or Moz.com?
Step 2: Projected revenue vs costs (converting clicks into profit)
How much does a car wrap cost? A manufacturer of vehicle wrap materials says anything from £1800 - £5000. A cost of £3000 - £5000 takes you into executive range, so a very good car wrap will be approx. £2000. This is about double what I actually saw by looking at rate cards for real businesses, but lets go with this figure for now.
Let’s assume that a vehicle wrap technician is paid same as mechanic (perhaps they are a mechanic). An industry website shows average salary for a mechanic in London as £31,065, so let’s go with £30k as a starting figure.
Here is a handy rule-of-thumb for web conversion rates:
- If your product/service costs less than £50 you can reasonably expect between 1% and 5% conversion rate (that is, the proportion of visitors that convert into paying customers). The higher rate assumes you are ranked in the top 3 results for a particular search.
- For products/services over £50 the conversion rate drops to 0.5% - 2%.
- It is reasonable to expect 1/3 of your web traffic to come from search, 1/3 from links from other sites and 1/3 direct (i.e. people already know your URL, maybe from local advertising in local newsprint, for example, but that will cost you too). The higher you rank on keyword search, the more traffic you can expect from search. If you can rank high enough to reach your target for search it’s a pretty good bet that the other two sources will fall in line.
With that in mind, let’s look at some numbers.
We’ll consider a worst case scenario first: figures from Moz.com, search term vehicle wrap. Let’s suppose there are 50 searches/month, each of which is directed to your website at the lowest conversion rate of 0.5% (i.e 50 visitors x 0.5% conversion rate x 12 months = 3 customers per year). Let’s also assume that this figure is matched by referrals from other sites and direct search using your URL. This equates to 9 customers per year, so let’s call it 10 for convenience. At £2000 per wrap, that equates to a revenue of 10 x £2,000 = £20,000/year (remember, this is revenue - we haven’t accounted for costs yet). Not so great!
Now let’s consider a best case scenario: figures from Google Ads keyword tool. Say 10k visitors/month at 2% conversion rate, that’s 10k searches x 2% conversion rate x 12 x £2000 = £4.8m/year revenue. Go for it!
Hold your horses. In both cases we’ve assumed all searches result in a visit to our website, but the reality is that the searches are spread across many UK businesses, not just your own. So, how many businesses am I competing against? A search on Yelp.com for vehicle wrap in London yields 8 pages of results, at 10 results / page. That gives roughly 100 competing businesses in London alone. Google’s results were for whole of UK. Even if we were splitting the revenue between only those businesses in London (and we aren’t) that gives a best-case annual revenue of £4.8m / 100 or £48k. However, we’re expecting to be in the top 3 results so let’s say we get 5% of the available customers rather than the 1% average. That gives us £4.8m x 5% = £240k. Let’s call it £250k revenue. We haven’t accounted for the 2/3 traffic coming from other sources, so this gives us £750k but this is a very optimistic figure. Let’s go with it for the sake of argument.
How much would it cost us to get into the top 3 search results? Well, we’re expecting 5% of the total traffic from Google at the most optimistic level, or 500 visits / month. At £1.79/click that’s an annual cost of £10,740/year at Googles rates (500 x 12 x £1.79), which according to smartinsight will be more like £20k/year in reality.
Remember that our optimistic calculation results in 360 car wraps/year (10k visits/month x 12 months x 2% conversion x 3 visitor sources x 5% share of market). There are approximately 254 working days / year, and an average car wrap takes approximately 4 days to complete (approx. 2 days to design, 2 days to wrap - based on visiting wrapper sites). 4 days x 360 wraps = 1440 person days to complete our inventory. At 254 person days per year this means we need 6 people on the team. At an average wage of £30k this will cost us £180k for the technicians alone. Add in the cost of materials (let’s say £100/vehicle or £36,000/year- I have no idea whether this is right but let’s go with it) we’re looking at total cost of sales of £180k wages + £20k advertising + £36k materials = £236k/year. Let’s call it a round £250k/year.
So, our revenue of £750k minus our costs of £250k leaves a gross profit of £500k. But wait, we haven’t accounted for all the other expenses we incur whether we make a sale or not (like rent, administration, other wages, interest on bank loans). Nor have we accounted for tax. Let’s suppose these additional costs add up to £100k per year, that still leaves us with a profit before tax of £400k. Assuming a tax rate of 30%, we end up with a profit of approximately £270k/year. Pretty sweet, right? Go out and start your vehicle wrap business right now.
Do you believe that figure?
If not, why not?
I’ve described a perfectly valid process and laid out all the calculations for you, so what’s the problem?
I’m hoping the answer is that you don’t believe me, because I’ve made too many unsubstantiated assumptions. If that’s the case, I agree with you. The process I’ve gone through here is reasonably sound, but I’ve made guesses at every stage. With so many stages to the calculation, is it any wonder that the result is so questionable? Which assumptions do you think were the biggest? What would you do instead to get a more accurate figure? Even if you did things differently, do you believe your result enough to give up your job and start a vehicle wrap business?
We’ve made a good start, but how can we come up with a more believable figure? First, we need to list our assumptions and then we need to create hypotheses to test those assumptions. How do you do that? I’ll give you some ideas in the next blog post!

Leave a Comment